I was surprised meteorologists apologized for a “blown forecast” for New York City’s snowstorm. Here was one forecast:
January 25: The New York City area is forecast to see a foot or more of heavy snow. Blizzard conditions are possible. Parts of eastern and southern New England, including Boston, Providence, Rhode Island, and Portland, Maine have the potential to see up to 2 feet of snow. Locally more than 2 feet of snow may fall, particularly in eastern Massachusetts. The snow will be accompanied by blizzard or near-blizzard conditions. Forecast to see a foot or more of heavy snow. Blizzard conditions are possible. They did not say “probable”.
Another headline said “NYC bracing for up to 3 feet of snow.” Later in the story, there was a comment that the amount predicted was more in the 20-30 inch range. That is a lot less. Most of the city got less than a foot, but NYC received snowfall. New England received what was predicted. This is not a blown forecast. It is taking the upper estimate, overhyping it, then complaining when it isn’t exactly right. As a physician, the famous 44,000 to 98,000 deaths caused by medical errors every year (very out of date data, now) was rounded to 100,000, and that figure was used almost exclusively. If one allows 100,000, one must equally allow 44,000. Neither is good, but the example is important.
I watched The Weather Channel the night of the storm, where one of the weather models predicted that NYC would get 3-5 inches. While that model was discounted, a model did predict the storm correctly.
A significant weather event was forecasted and it occurred. I think the problem is how uncertainty is handled in both the scientific and lay communities. Uncertainty to a scientist allows for a range of possibilities, since weather cannot be predicted completely accurately, and one of those possibilities affected a lot of people. Uncertainty to the general public too often means, “They don’t have any idea what they are talking about.”
Worse, the so-called “blown forecast” had comments from those who feel climate is not changing. After all, the headline postulated, if you can’t predict a snowstorm 2 days in advance, why should we believe you about 100 year forecasts? More on this later.
Years ago, a leading weatherman on the Tucson news suddenly changed his forecasts from 5 days to 7. He had used 5 day forecasts, because he felt there was too much uncertainty out 7 days. I wrote him to ask why he had changed. He replied that he had been to a conference of TV Weathermen and learned that the general public wanted 7 day forecasts.
So? Why should we accede to their wishes by giving them a lot of potentially wrong information?
There are many weather models; some are better than others for certain conditions or in certain years. “The GFS has been trending wetter than reality this year,” is not an uncommon statement. The other issue is with a weather system, a shift in the track of 50 miles makes a huge difference, as we have learned with hurricanes…..and low pressure systems. Had Katrina come ashore 50 miles further east, it is likely that the surge of water from Lake Pontchartrain would not have flooded the city. Had the current low pressure system been 50 miles closer to NYC, nobody would be complaining about the forecast, only the outcome.
There is a big problem in America about understanding probability, and it doesn’t help to have “I’m not a scientist” mentality in Congress and “math is nerdy” mentality in the country. Weather forecast apps give exact temperature and probability of rain per hour, which to me is ludicrous. They give exact temperatures for 10 days in the future, which is nonsense. People believe these forecasts, because the idea of a range of temperatures is foreign to them (“can’t you be exact?”) and the fact that weather models may miss initial conditions that lead to major changes, especially when they are trying to model the ocean.
I have studied weather models 16 days in the future model rainfall in Oregon. During that time, I have seen waffling of the models, putting high pressure anywhere from the Great Basin to the Eastern Pacific. The storm expected next weekend, as I write, was on and off the models for several days, before the last 5 days, when it has consistently been present, but the expected severity of rainfall is not consistent. Still, I see forecast rainfalls to the nearest hundredth of an inch over a wide swath of Oregon and Washington. This is senseless. Five days before the forecast discussions, I have been predicting a major weather pattern change for Oregon next weekend. Only when the models were in agreement about 8 days out, did the local weather discussions start to mention the pattern change as a possibility. Today, the discussion said the models were in surprising agreement about the rain event, but not exactly where it will be maximal.
Climate is very different, for all the weather changes over decades are smoothed out, and one can become quite confident what the overall picture looks like. It’s like tossing a coin. You know that 50% of the time it will come up heads, but you could be 50% wrong on the first toss. Do it 10 times, and the probability of exactly 5 heads actually decreases, but the probability of 4,5,and 6, are about 65%. Already, the probability is trending towards 50%. The probability of 0 heads is less than 0.1%.
Indeed, as you increase the number of tosses, the percentages trend closer and closer to 50%, as to be insignificantly different. Climate models work this way, too. No, we can’t predict the number of snowstorms NYC will have in 2100. We can predict, however, the range of temperature rise on the Earth and the range of rise in the oceans. We can also predict the amount of carbon dioxide in the atmosphere. These ranges have very high confidence, a statistical term meaning the likelihood of an unknown value, such as increase in global temperature in the year 2100, could be in a range of values, none of which is zero or negative, if we are 95% confident. I have never seen a confidence interval (CI) quoted by someone who denies global warming is occurring. The IPCC’s confidence has been known for years. CIs are a scientist’s way of saying, “I might be wrong.”
Next hurricane season, look at the cone of uncertainty for hurricane motion. So many models are used that they are called “spaghetti plots.” One could go back to the days of prayer and magical thinking, or one could look at the GFS, ECMWF, or NOGAPS, to name three. With a great deal of ease, one can have an idea of what the weather may be like several days in advance. It’s worth learning about uncertainty; after all, it is the basis of our existence.
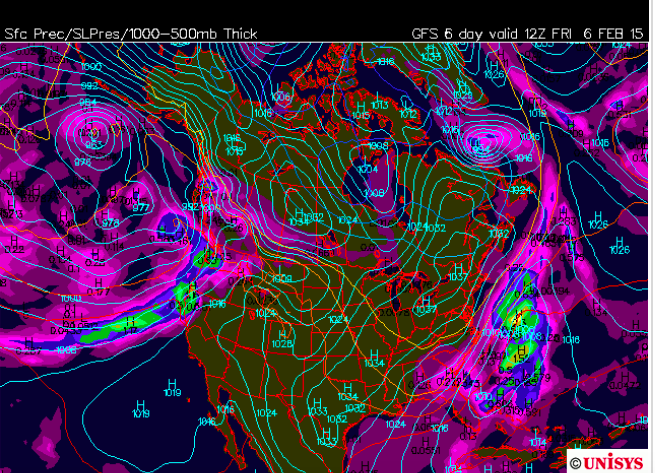
Below: GFS Model showing precipitation (purple), heavier (blue and green) along with the 1000-500 mb thickness (one measurement of high and low pressure). This is 6 days out, at 12 Z 6 February, or 4 a.m. Friday. It shows that the Pacific Northwest is going to be wet, and northern California may get a strong shot of rain. Notice the rain in the southeast and off the east coast. The GFS has a panel of 10 days, with 1/2 day intervals. The GFS has been showing this for several days, but the focus of the heavy rain has not been consistent.
Tags: Philosophy

Leave a comment